By: Pakarada Premtitikul
General Manager
InterDry (Thailand) Co., Ltd.
Container Floor Tests
Speed of achieving a hygroscopic equilibrium.
In this experiment, a piece of plywood, used for container flooring at MSC, was conditioned at 23 ° C and 50% relative humidity. The piece of wood was placed in a climate test cabinet at 45 ° C and 75% RH where the wood absorbs moisture. Every day the wood was weighed and the moisture content of the wood was determined. With this procedure we have more knowledge about the speed at which wood reaches its hygroscopic balance.
The wood was protected with tape in places where in reality it is not subjected to the internal container air. Following pictures show how the wood was protected.
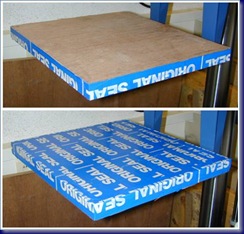
The tested piece of wood top and bottom.
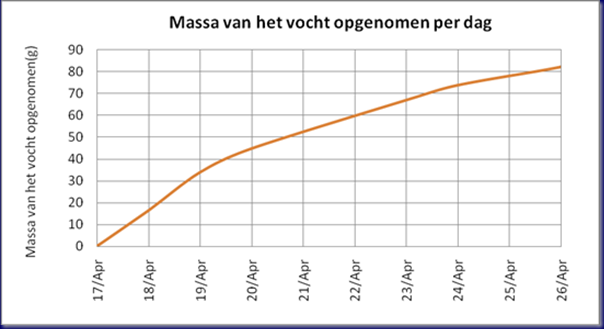
The initial mass of the wood was 3259g. Following graphs show the results of the test. The first chart shows the mass of absorbed moisture per day. The second chart shows the increase in the moisture content of wood per day.
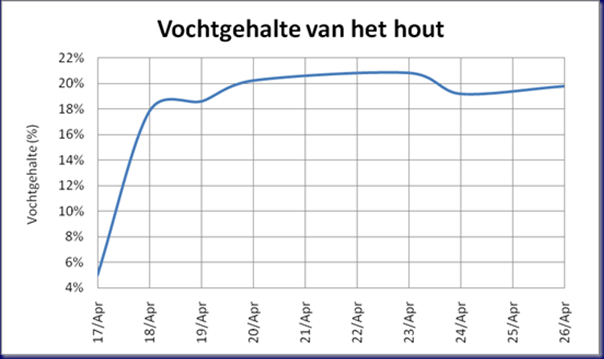
Increase in the moisture content of wood
Unfortunately, the hygroscopic equilibrium had not been reached before the trial was stopped. The moisture content remained almost constant after 3 days. Yet the wood continued absorbing moisture. Since it is plywood, that means that once the moisture content of the top layer remains constant, the moisture will move to the lower layers of wood.
Comparison of the climate of two containers at MSC.
In order to see the difference between climate change and the change in the moisture content of the container floor in a container with a desiccant and a container without desiccant, the following experiment was made.
Two containers at MSC were used for this test. One container (container U6472633 MSC) was provided with desiccant and the other container (U1089745 MSC) was left as it was. The ventilation holes in the two containers were sealed with tape.
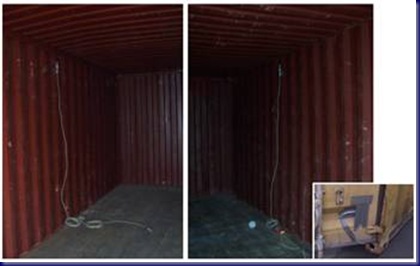
A data logger was used in both containers to measure the changing climatic conditions. In container U6472633 MSC a probe was placed near the ceiling and a probe on the floor. In container U1089745 MSC a probe was mounted on the ceiling and a probe on the outside of the door to measure the outdoor conditions. Following figure shows the positions of the probes of logger 56,844 in container MSC U6472633 and logger 56,845 in container U1089745.
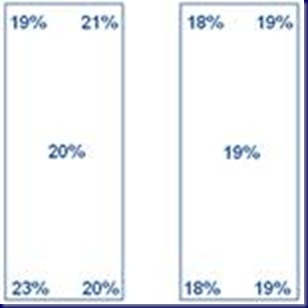
Before the container doors were closed, the moisture content of the floors were measured. Following figure shows the moisture content of the container floor at various locations in the two containers before the start of the trial.
The test was performed over a period of 28 days at the port of Antwerp, and below are the results of the data loggers.
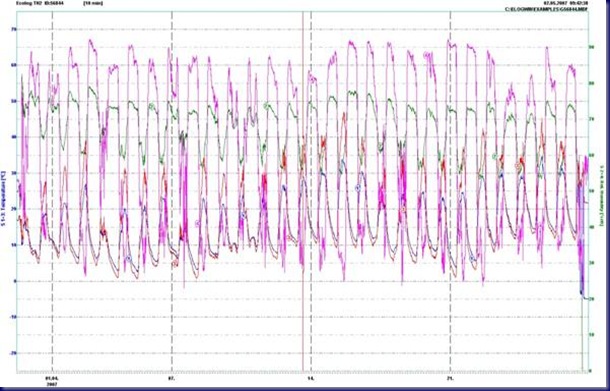
Data logger 56844:
The purple curve and the green curve are respectively the relative humidity near the ceiling and the relative humidity near the container floor.
It can clearly be seen that fluctuations in relative humidity in the vicinity of the ceiling are much higher than those in the vicinity of the floor.
The purple curve shows maxima of 85% and 90% and minima of 30% and 40%. The green curve shows maxima of 70% and 75% and minima of 55% and 60%.
The blue curve and red curve are respectively the temperature near the ceiling and the temperature near the floor.
The fluctuations near the ceiling were slightly larger than those near the floor. The minima of both are roughly equal at about 10° C. The maximum temperature at the ceiling was about 40 ° C and at the floor approximately 30° C.
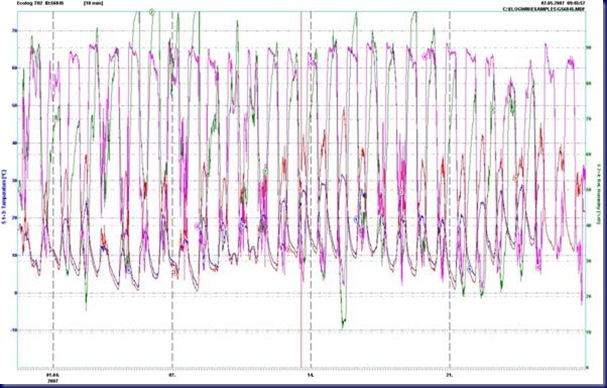
Data logger 56845:
The purple curve and the green curve are respectively the relative humidity near the ceiling and the relative humidity outside the container.
The fluctuations of relative humidity are not comparable because outside the container it was sometimes larger and sometimes smaller.
The blue curve and red curve are respectively the temperature near the ceiling and the temperature outside the container. Minima are comparable, but the maxima showed extreme differences. The maximum temperature at the ceiling was about 40 ° C and outside about 30 ° C.
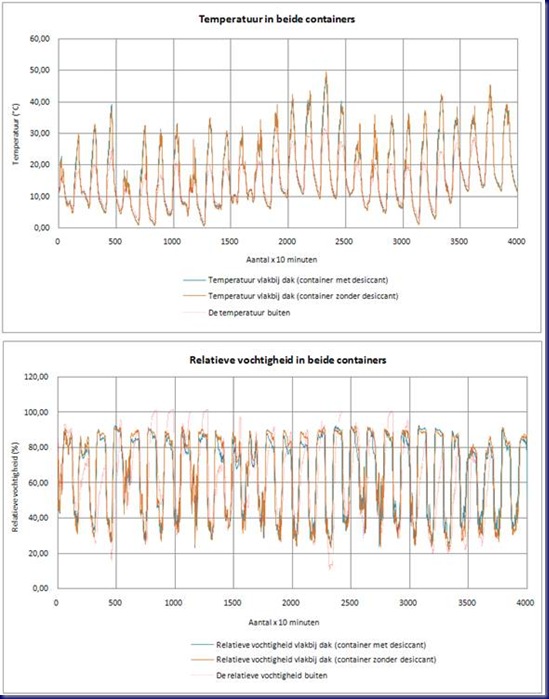
For a better comparison between the climate of both containers, the temperature changes and changes in the relative humidity near the ceiling are shown in the figure below.
The temperature and relative humidity within containers MSC U6472633 and MSC U1089745 and outside.
The temperatures were almost exactly the same. The relative humidity, however, showed some differences. The relative humidity in the container with the desiccant showed smaller maxima.
The explanation lies in the fact that an amount of moisture was absorbed by the desiccant resulting in less moisture in the air, resulting in a lower relative humidity.
After weighing the desiccant, it was discovered that a total of 4.465 kg of moisture was absorbed. Since the air in a container itself contains little moisture, this must have been moisture from the floor. The desiccant always causes a lower relative humidity in the air so the floor was looking for a new hygroscopic equilibrium. Therefore, the moisture of the floor in the container with desiccant should have dropped as well. Next figure shows that this indeed is correct.
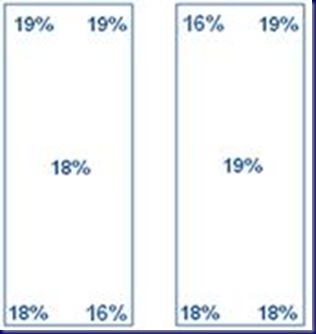
The moisture content of the container floor in MSC U6472633 decreased 2 to 5%, while the moisture content in container MSC U1089745 remained constant.
Climate control inside a container is a very difficult task.
There are so many variables to be taken into consideration that it is practically impossible to determine a precise figure on the number of desiccant needed within a container.
Nevertheless, significant conclusions can be made such as the fact that a container floor is one of the main sources of humidity.
Desiccant always absorb more at higher temperatures and higher relative humidity. High relative humidity provides a high absorption capacity, while a high temperature results in faster moisture absorption.
If the packing unit increases in mass, the rate of absorption decreases, but the active absorption time increases.
When comparing the different desiccant products two main groups are distinguished by their absorption properties, namely the rapid absorbers and those with a long effective absorption time. If a rapid moisture-absorption is desired, for example for a shorter sea voyage, the first group of desiccants holds perhaps the greatest advantage. If a constant fluid intake is desired, the second group is the most desirable.
As the products that continue to absorb also the ones that absorb the most, fewer units are needed for this type of desiccant which is a big advantage. It should be noted that the desiccants with faster absorption, are the clay based desiccants. The desiccants that ultimately absorb the most are the desiccant based on salt.
From the test at MSC can be concluded that desiccants work. Products succeed in absorbing the moisture from the wood to bring down the relative humidity in the air. Because the relative humidity is lower, a new hygroscopic equilibrium needs to be created. In the MSC container was that new hygroscopic equilibrium was created by the wooden floor expelling moisture.
Finally, it should be noted that the choice of desiccant is not easy, but it is determined by a diverse range of interacting conditions such as type of cargo to be shipped, the length of the voyage, the sea route, the season the container is transported and so on.
Related articles




One will never say it enought : the packing and proctection of the goods is the most important thing for a shipping success 🙂
Pingback: Nordic Power Desiccant – Frequently Asked Questions: « Interdry (Thailand) Co., Ltd.