Our blog has moved to:
www.wordpress.interdrythailand.com
Of course you are free to browse this blog and leave your comments.

Our blog has moved to:
www.wordpress.interdrythailand.com
Of course you are free to browse this blog and leave your comments.
By: Pakarada Premtitikul
General Manager
InterDry (Thailand) Co., Ltd.
Let’s have a look at three commonly used shipping routes and what this does to the temperature and humidity inside the shipping container.
We’ve chosen three routes, namely Japan – Netherlands, Japan – Memphis and Japan – Portland.
A normal shipment consists of three distinct stages. The first stage includes the time from container filling until the container is loaded onto a ship. This includes road transportation and brief periods of storage. Daily cycles of temperature and humidity are common. For example, figure 2 includes temperature swings of 40° F [22°C] during the first stage of a shipment from Japan to The Netherlands.
The second stage is the actual time at sea or aboard a ship. This may or may not be the longest stage during the container’s journey. During this stage, daily cycles of temperature and humidity are usually very minor or completely non-existent. Temperature changes are gradual, often occurring over days rather than hours. Occasionally, a single temperature/ humidity cycle occurs as the ship makes stops along the route, however extreme conditions are rare. Figure 3 includes a slow temperature rise and fall as a winter route takes the ship near the equator and then north to The Netherlands.
The final stage begins when the container is removed from the ship and continues until the recorder is removed during the freight unloading process. This may include varying periods of time spent in customs, on trains, on trucks, and in storage. Daily temperature and humidity cycles are common and may be extreme.
Typical summer shipment – Japan to the Netherlands
Typical winter shipment – Japan to the Netherlands
Some of the most interesting recordings are the extreme conditions. The highest recorded temperature occurred on July 25, 2005 during a shipment from Japan to Memphis. The temperature reached 135° F [57° C] during the third stage of this shipment (figure 7).
Hottest shipment 135°F (57°C) – Japan to Memphis (USA).
Coldest shipment -21°F (-29° C) – Japan to Memphis (USA).
The lowest recorded temperature occurred on January 15, 2005 also along the Japan to Memphis route (figure 8). The temperature dropped to -21° F [-29° C], which is slightly beyond the recorder’s published temperature range.
The shipment with the highest relative humidity occurred during a trip from Japan to Portland. The relative humidity was recorded at 96% on August 5, 2005 while the container was on land. Figure 6 shows the detailed temperature and humidity profile. The most extreme humidity conditions are seen during periods of large daily temperature changes. In this example, as the temperature slowly drops from 88° F [31° C] to 67° F [19° C] over 9 days, the humidity increases to 88% before returning to 79%. However, starting on August 4 as the temperature dropped from 121° F [49° C] to 68° F [20° C] over a 16 hour period, the relative humidity rose from 32% to 96%. The corrugated boxes seem to absorb moisture fast enough to temper humidity during slow changes in temperature while at sea. However, rapid temperature changes seen on land seem to exceed the rate at which the corrugated boxes can absorb moisture.
Highest relative humidity 96% – Japan to Portland (USA).
Be sure to check out the following page for more information on how desiccants can save your valuable cargo:
By: Pakarada Premtitikul
General Manager
InterDry (Thailand) Co., Ltd.
In this experiment, a piece of plywood, used for container flooring at MSC, was conditioned at 23 ° C and 50% relative humidity. The piece of wood was placed in a climate test cabinet at 45 ° C and 75% RH where the wood absorbs moisture. Every day the wood was weighed and the moisture content of the wood was determined. With this procedure we have more knowledge about the speed at which wood reaches its hygroscopic balance.
The wood was protected with tape in places where in reality it is not subjected to the internal container air. Following pictures show how the wood was protected.
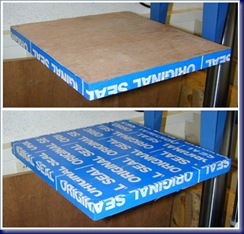
The tested piece of wood top and bottom.
The initial mass of the wood was 3259g. Following graphs show the results of the test. The first chart shows the mass of absorbed moisture per day. The second chart shows the increase in the moisture content of wood per day.
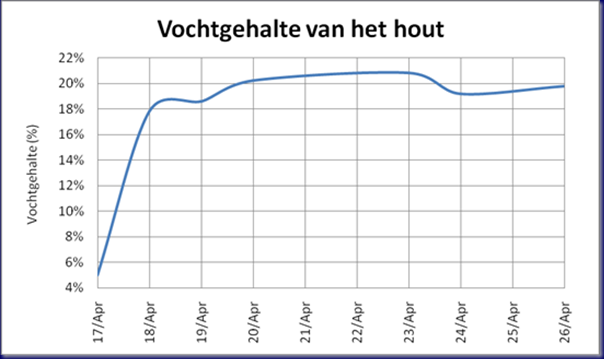
Increase in the moisture content of wood
Unfortunately, the hygroscopic equilibrium had not been reached before the trial was stopped. The moisture content remained almost constant after 3 days. Yet the wood continued absorbing moisture. Since it is plywood, that means that once the moisture content of the top layer remains constant, the moisture will move to the lower layers of wood.
In order to see the difference between climate change and the change in the moisture content of the container floor in a container with a desiccant and a container without desiccant, the following experiment was made.
Two containers at MSC were used for this test. One container (container U6472633 MSC) was provided with desiccant and the other container (U1089745 MSC) was left as it was. The ventilation holes in the two containers were sealed with tape.
A data logger was used in both containers to measure the changing climatic conditions. In container U6472633 MSC a probe was placed near the ceiling and a probe on the floor. In container U1089745 MSC a probe was mounted on the ceiling and a probe on the outside of the door to measure the outdoor conditions. Following figure shows the positions of the probes of logger 56,844 in container MSC U6472633 and logger 56,845 in container U1089745.
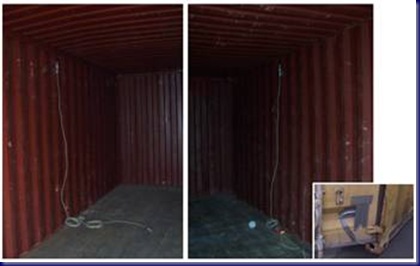
Before the container doors were closed, the moisture content of the floors were measured. Following figure shows the moisture content of the container floor at various locations in the two containers before the start of the trial.
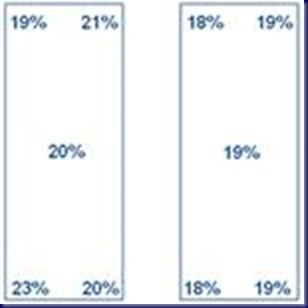
The test was performed over a period of 28 days at the port of Antwerp, and below are the results of the data loggers.
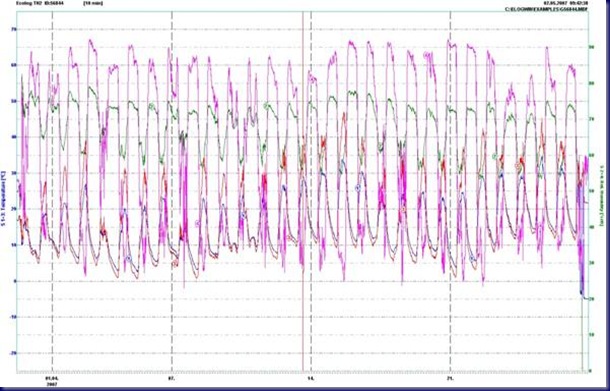
The purple curve and the green curve are respectively the relative humidity near the ceiling and the relative humidity near the container floor.
It can clearly be seen that fluctuations in relative humidity in the vicinity of the ceiling are much higher than those in the vicinity of the floor.
The purple curve shows maxima of 85% and 90% and minima of 30% and 40%. The green curve shows maxima of 70% and 75% and minima of 55% and 60%.
The blue curve and red curve are respectively the temperature near the ceiling and the temperature near the floor.
The fluctuations near the ceiling were slightly larger than those near the floor. The minima of both are roughly equal at about 10° C. The maximum temperature at the ceiling was about 40 ° C and at the floor approximately 30° C.
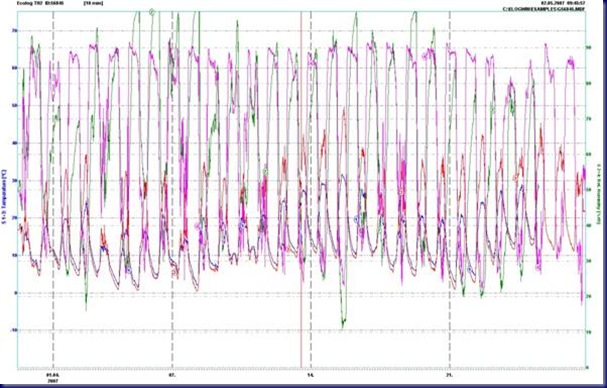
The purple curve and the green curve are respectively the relative humidity near the ceiling and the relative humidity outside the container.
The fluctuations of relative humidity are not comparable because outside the container it was sometimes larger and sometimes smaller.
The blue curve and red curve are respectively the temperature near the ceiling and the temperature outside the container. Minima are comparable, but the maxima showed extreme differences. The maximum temperature at the ceiling was about 40 ° C and outside about 30 ° C.
For a better comparison between the climate of both containers, the temperature changes and changes in the relative humidity near the ceiling are shown in the figure below.
The temperatures were almost exactly the same. The relative humidity, however, showed some differences. The relative humidity in the container with the desiccant showed smaller maxima.
The explanation lies in the fact that an amount of moisture was absorbed by the desiccant resulting in less moisture in the air, resulting in a lower relative humidity.
After weighing the desiccant, it was discovered that a total of 4.465 kg of moisture was absorbed. Since the air in a container itself contains little moisture, this must have been moisture from the floor. The desiccant always causes a lower relative humidity in the air so the floor was looking for a new hygroscopic equilibrium. Therefore, the moisture of the floor in the container with desiccant should have dropped as well. Next figure shows that this indeed is correct.
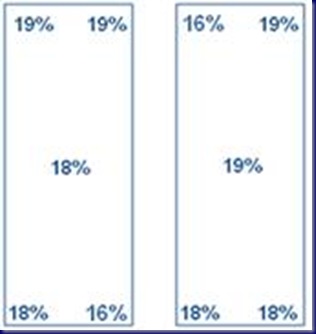
The moisture content of the container floor in MSC U6472633 decreased 2 to 5%, while the moisture content in container MSC U1089745 remained constant.
There are so many variables to be taken into consideration that it is practically impossible to determine a precise figure on the number of desiccant needed within a container.
Nevertheless, significant conclusions can be made such as the fact that a container floor is one of the main sources of humidity.
Desiccant always absorb more at higher temperatures and higher relative humidity. High relative humidity provides a high absorption capacity, while a high temperature results in faster moisture absorption.
If the packing unit increases in mass, the rate of absorption decreases, but the active absorption time increases.
When comparing the different desiccant products two main groups are distinguished by their absorption properties, namely the rapid absorbers and those with a long effective absorption time. If a rapid moisture-absorption is desired, for example for a shorter sea voyage, the first group of desiccants holds perhaps the greatest advantage. If a constant fluid intake is desired, the second group is the most desirable.
As the products that continue to absorb also the ones that absorb the most, fewer units are needed for this type of desiccant which is a big advantage. It should be noted that the desiccants with faster absorption, are the clay based desiccants. The desiccants that ultimately absorb the most are the desiccant based on salt.
From the test at MSC can be concluded that desiccants work. Products succeed in absorbing the moisture from the wood to bring down the relative humidity in the air. Because the relative humidity is lower, a new hygroscopic equilibrium needs to be created. In the MSC container was that new hygroscopic equilibrium was created by the wooden floor expelling moisture.
Finally, it should be noted that the choice of desiccant is not easy, but it is determined by a diverse range of interacting conditions such as type of cargo to be shipped, the length of the voyage, the sea route, the season the container is transported and so on.
Related articles

The terms absorption and adsorption are used freely to indicate the same process of taking moisture from the air using desiccants, mostly because we don’t want to complicate the explanation of what our product does. But there is a difference.
Absorption generally refers to two phenomena which are largely unrelated. In one case, it refers to when atoms, molecules, or ions enter some bulk phase – gas, liquid or solid material. For instance, a sponge absorbs water when it is dry.
Absorption also refers to the the process by which the energy of a photon is taken up by another entity, for example, by an atom whose valence electrons make transition between two electronic energy levels. The photon is destroyed in the process. The absorbed energy may be re-emitted as radiant energy or transformed into heat energy. The absorption of light during wave propagation is often called attenuation. The tools of spectroscopy in chemistry are based on the absorption of photons by atoms and molecules.
Adsorption is similar, but refers to a surface rather than a volume: adsorption is a process that occurs when a gas or liquid solute accumulates on the surface of a solid or, more rarely, a liquid (adsorbent), forming a molecular or atomic film (the adsorbate). It is different from absorption, in which a substance diffuses into a liquid or solid to form a solution. This is what happens to calcium chloride desiccants in container shipments.
Sorption encompasses both processes, while desorption is the reverse process.
* Taken from Wikipedia.
We are very excited to announce our new product: “Ecopack Clay Desiccant”. Ecopack consists of highly absorbent natural clay mixed with CaCl2 (Calcium Chloride).
Ecopack is typically used for the protection of goods in containers over long distances and through various climate zones. Ecopack is ideal for goods shipped in jute bags, cardboard cartons, wooden cases or crates or unpacked goods.
It is very safe in use especially at saturation as the beads remain hard and maintain moisture. Ecopack does not leak.
Its price is competitive, it absorbs more than silica and it fulfils REACH regulation requirements (DMF and Cobalt Chloride free).
Unlike silica gel, Ecopack is environment friendly, non toxic and can be disposed of as normal waste.
For those clients requesting a high quality desiccant with superior absorption rate, slightly more expensive CaCl based desiccants are still the best choice.
Come and check it out at: http://www.interdrythailand.com/products/clay_desiccant.htm

1. What is Relative Humidity (RH)? Relative humidity measures the amount of moisture in the air. It is expressed in a percentage of how much moisture the air could possibly hold. The wetter or damper the air is, the higher the relative humidity. The drier the air feels, the lower the relative humidity. Thus, 100% humidity is actually rain.
2. When stuffing a container in any climate, you also stuff the actual humidity contained in the air at the place of packing.
3. When closing the container, the humidity is contained in a very small space. As the container is moved from one climate to another, the humidity vaporizes up into the ceiling of the container, where it will start to rain down onto the cargo. Either the humidity will start to soak into the cargo or run along the surface of i e steel products. It can also turn into water that runs towards the bottom of the container. Nordic Power Desiccant actually "catches" the moisture before it vaporizes.
4. As soon as the climate changes, the moisture will either vaporize again or really start making trouble among your different products being shipped, if you do not use a desiccant. The longer the transportation time – the more damage may possibly develop.
5. You may have seen your cargo being loaded in perfect condition. But have you ever opened a container full of moulded furniture? Or rusty motor equipment? Or rice sacks full of mildew? Or fruit covered in fungus? The customers do not like it. They will blame you. They will lose money and time, they will lose their customers and they will make claims to you. Then you will lose money and time, and possibly even the client. Since there are many parties along the transportation chain, many may be blamed for damaged goods – like manufacturers, traders, shipping lines and forwarders. Why be among them?
6. Other desiccants being used are i.e. silica gel. Silica gel is the most common type of desiccant in use today. It is a porous sand and can absorb moisture in the air, often up to 40 % of it´s weight. However, silica gel absorbs moisture best in small, confined spaces and often end up getting saturated in a very short time span, making it unsuitable for container shipments. When saturated, it will not help catching the moisture anymore. Be aware that some silica gel – the blue contains cobalt – is toxic, and can not be disposed of any which way.
7. The best insurance there is – using Nordic Power Desiccants. The effect is 40 – 60 % better than other products in the market.
